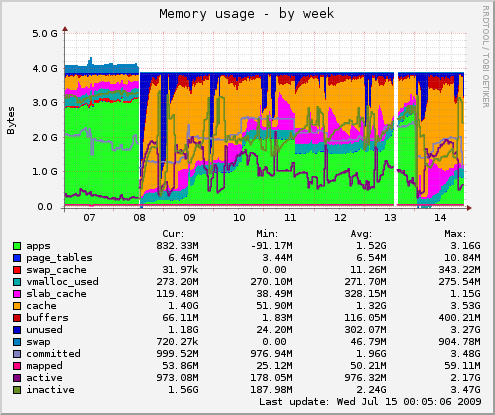
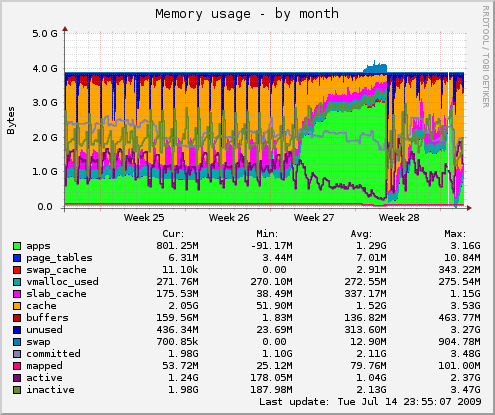
Last few weeks I have been struggling with memory usage on one of machines which run several OpenVZ containers. It was eating whole memory in just few days:

I was always fond of graphing system counters, and since reboots are never a good thing something had to be done. One of first things that jumps out is that weekends are quiet, and don't generate 1Gb of additional memory usage. So it had something to do with out workload when library was open. But, what?
Even, worse, it all started only two weeks ago!

Occasional look at ps axvv wasn't really something which is useful in debugging this problem, and I needed more precise information. So, I opted for simplest possible solution: record memory usage using vzps from crontab with following shell script:
#!/bin/sh

cd /srv/ps-trend
dir=`date +%Y-%m-%d`
test -d $dir || mkdir $dir
COLUMNS=256 vzps -eo veid,pid,ppid,ni,user,rss,sz,vsz,time,stat,f,command > $dir/`date +%H%M`
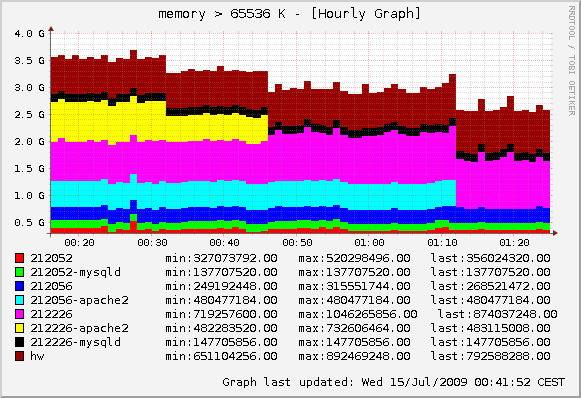
After collecting several hours of trace, I decided to group them by container, and by all processes which have more than 64Mb of memory usage. Sometimes, it's amazing how solution jumps out by itself if you describe your problem good enough to computer (and draw a graph :-)

After I identified that two Apache instances where eating memory like crazy, I remembered one of fellow sysadmins who complained about threaded Apache installation where some Apache child processes would mysteriously take 256Mb of RAM memory each. Just some, not all. Of course, I had several of them.
My solution to problem was also simple:
# sudo apt-get install apache2-mpm-prefork
It seems that threaded model in current Apache 2 just isn't good for me. Which is strange because application is basically a bunch of CGI scripts.
Result is not bad: 1Gb of additional free memory (which will be used for file-system cache). Not leaking anymore will also save us from hitting swap which was so bad that first reboot was needed. If nothing else, remember that tracing system counters and graphing them is always good investment in time, because pictures can tell different story than raw data. Especially if you have a lot of raw data (20k per minute in this case)
It would be nice to turn this into full monitoring solution. I really like idea of minimal client deployment for monitoring, so something like ps and curl to push data directly to graphing server, and triggered from crontab (with possibility to parse e-mail and insert them for later recovery from network interruptions) might just be a solution which I would recommend. Remember, Linux is operating system. It can do a lot of thing by itself :-)
If you just want light-weight graphs for your machines RRD::Simple Monitoring server has light-weight perl client (single perl script which submits to CGI script on server) which is triggered from cron. This project was inspiration to give RRD::Simple a try.