We have been running ganeti cluster in our institution for more than a year now. We did two cycles of machine upgrades during that time, and so far we where very pleased with ability of this cloud platform. However, last week we had a problem with our instances -- two of them got owned and started generating DoS service attack to external resources. From our side it seemed at first like our upstream link is over saturated, and we needed to way to figure out why it is.
At first, it seemed like this would be easy to do. Using dstat,i I found that we are generating over 3 Gb/s traffic every few seconds to outside world. We have 1 Gb/s upstream link, but our bonded interfaces on ganeti nodes can handle 3 Gb/s of traffic, so for a start we where saturating our own link.
But which instance did that? I had to run dstat on every node in our cluster until I found two nodes which had instances which where overloading our link. Using iftop I was able to get hostname and IP address of instances which I wanted to shut down. However, this is where problems started. We didn't have DNS entries for them, and although I had IP and mac address of instances I didn't had easy way to figure our which instance has that mac.
Than I figured out that I can get mac from kvm itself, using ps. Once I found instances it was easy to stop then and examine what happened with them.
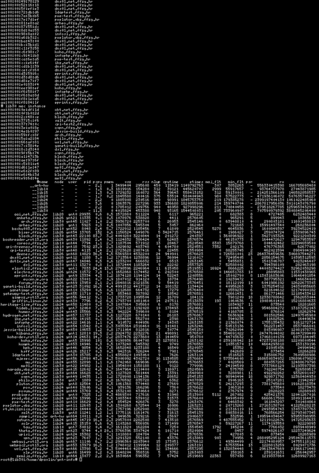
But, this got me thinking. Every time I have a troubleshooting problem with ganeti, I basically use more or less same command-line tools to figure out what is going on. But I didn't have a tool which would display me some basic stats about instance, but including mac addresses and network traffic (which in our configuration are tap devices added to bridges). So I wrote, gnt-info which presents nice overview of your instances in ganeti cluster which you can grep to drill-down into particular instance or host.