Results matching “openvz”

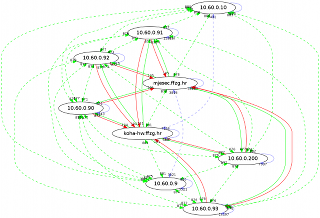
I wrote initial version of bak-git more than a month ago, and started using it to manage my share of Internet cloud. Currently, it's 16 hosts, some of them real hardware, some OpenVZ or LXC containers.

Since then, I implemented two new features in bak-git:

  • lighttpd configuration for gitweb with ssl and auth (so you can easily review your changes)
  • ability to do diff and revert on remote hosts
Having all configuration files in central place should allow central management of shared part. Let's see how we can manage central apt proxy configuration which should be shared between machines in your lib cloud (cluster, intranet, whatever...)

On central node, you create proxy configuration under new fake host _lib

dpavlin@klin:~/klin/backup$ cat _lib/etc/apt/apt.conf.d/02proxy 
Acquire::http { Proxy "http://10.60.0.91:3142"; };
Then you can login into any other host and check:
dpavlin@mjesec:~$ bak diff _lib:/etc/apt/apt.conf.d/02proxy
no output, so same as in central _lib configuration, but
dpavlin@opl:~$ bak diff _lib:/etc/apt/apt.conf.d/02proxy
--- opl/etc/apt/apt.conf.d/02proxy      1970-01-01 01:00:00.000000000 +0100
+++ _lib/etc/apt/apt.conf.d/02proxy     2010-03-18 23:22:55.000000000 +0100
@@ -0,0 +1 @@
+Acquire::http { Proxy "http://10.60.0.91:3142"; };
This seem like missing configuration. Let's install it (revert from shared configuration template _lib):
dpavlin@opl:~$ bak revert _lib:/etc/apt/apt.conf.d/02proxy
Have in mind that this didn't commit this configuration change to bak-git, it just created file on local file system.

bak diff hostname:/path is more powerful than that. It can make diff of file which isn't tracked on remote host with local one, allowing easy comparison of any file on file-system to another file with same path on remote host. As a (useful) side-effect, file will be copied to central server, but not committed. You can choose to commit it later, or remove it from backup directory, but handy copy at diff time is nice to because it records your interest in that file.

I also misused git's Author: field to track user which committed change:

Author: root/dpavlin 
This means that I was using sudo to become root on hostname prod. To create more useful log in gitweb, I also prefixed messages with hostname: to create nicer output in gitweb:

bak-git-gitweb-messages.png

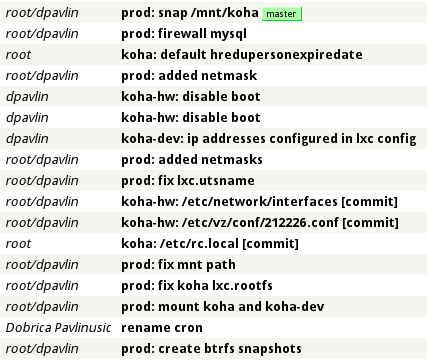
I don't like inserting redundant information in message, but it's very useful to see author, hostname and message at a glance and if you want more details, you can always use bak log or bak changes on hosts or git directly in your backup directory:

dpavlin@klin:~/klin/backup$ git log --stat
commit 3ba2f2ebde044232983e0ea9ffdeb2afc0012cf9
Author: root/dpavlin <prod>
Date:   Sat Mar 27 01:12:15 2010 +0100

    prod: snap /mnt/koha

 prod/etc/cron.d/btrfs-snap |    1 +
 1 files changed, 1 insertions(+), 0 deletions(-)

commit 40779a5c13ee12462b3b50f7ea1ace2363facd58
Author: root/dpavlin <prod>
Date:   Sat Mar 27 00:54:15 2010 +0100

    prod: firewall mysql

 prod/etc/rc.local |   18 ++++++++++++++++++
 1 files changed, 18 insertions(+), 0 deletions(-)

commit 6a433b853c9da2817bc76afa2e35cc1ed360c590
Author: root <koha>
Date:   Fri Mar 26 23:29:00 2010 +0100

    koha: default hredupersonexpiredate

 koha/etc/koha/koha-conf.xml |    2 ++
 1 files changed, 2 insertions(+), 0 deletions(-)

I have been playing with Linux containers for a while, and finally I decided to take a plunge and migrate one of my servers from OpenVZ to lxc. It worked quite well for testing until I noticed lack of support for automatic startup or shutdown. lxc-users mailing list was helpful in providing useful hints and I found 5 OpenSUSE scripts but decided it's too complicated for task at hand.

I wanted single script, for easy deployment on any Debian box, with following features:

  • reboot and halt from inside container should work as expected
  • cleanly shutdown or reboot container from host (as opposed to lxc-stop which is equivalent to turning power off)
  • init script to start and stop containers on host boot and shutdown

Result is lxc-watchdog.sh. It can start containers (and remember to start it on next host reboot), reboot or halt containers from host (using signals to trigger container's init) and automatically configure your container when you start it for the first time. Here is quick overview:

root@prod:/srv# ./lxc-watchdog.sh status
koha-240 RUNNING boot /virtual/koha-240
koha-241 STOPPED boot /virtual/koha-241
koha-242 STOPPED      /virtual/koha-242

root@prod:/srv# ./lxc-watchdog.sh start
# start koha-240
'koha-240' is RUNNING
# start koha-241
2010-03-16T23:44:16 koha-241 start
'koha-241' is RUNNING
# skip start koha-242

root@prod:/srv# ./lxc-watchdog.sh status
koha-240 RUNNING boot /virtual/koha-240
koha-241 RUNNING boot /virtual/koha-241
koha-242 STOPPED      /virtual/koha-242

root@prod:/srv# ls -al /var/lib/lxc/*/on_boot
-rw-r--r-- 1 root root 9 2010-03-16 21:40 /var/lib/lxc/koha-240/on_boot
-rw-r--r-- 1 root root 9 2010-03-16 21:40 /var/lib/lxc/koha-241/on_boot
-rw-r--r-- 1 root root 0 2010-03-16 22:58 /var/lib/lxc/koha-242/on_boot
As you can see, I used file /var/lib/lxc/name/on_boot to record which machines to bring up. When container is started for the first time, it will have boot enabled (just in case this is production application which you will reboot in 6 months and then wonder why it doesn't work). You can change boot status using:
root@prod:/srv# ./lxc-watchdog.sh boot koha-242
# boot koha-242

root@prod:/srv# ./lxc-watchdog.sh status
koha-240 RUNNING boot /virtual/koha-240
koha-241 RUNNING boot /virtual/koha-241
koha-242 STOPPED boot /virtual/koha-242

root@prod:/srv# ./lxc-watchdog.sh disable koha-242
# disable koha-242
Installation as init script /etc/init.d/lxc-watchdog is easy:
root@prod:/srv# ln -s /srv/lxc-watchdog.sh /etc/init.d/lxc-watchdog

root@prod:/srv# update-rc.d lxc-watchdog defaults
update-rc.d: using dependency based boot sequencing
And finally, it can also be used to manually start, halt or reboot containers:
root@prod:/srv# /etc/init.d/lxc-watchdog start koha-242
# start koha-242
2010-03-16T23:47:46 koha-242 start
'koha-242' is RUNNING

root@prod:/srv# /etc/init.d/lxc-watchdog status
koha-240 RUNNING boot /virtual/koha-240
koha-241 RUNNING boot /virtual/koha-241
koha-242 RUNNING      /virtual/koha-242

root@prod:/srv# /etc/init.d/lxc-watchdog restart koha-242
# restart koha-242
2010-03-16T23:48:46 koha-242 kill -SIGINT 24838

root@prod:/srv# /etc/init.d/lxc-watchdog status
koha-240 RUNNING boot /virtual/koha-240
koha-241 RUNNING boot /virtual/koha-241
koha-242 RUNNING      /virtual/koha-242

root@prod:/srv# /etc/init.d/lxc-watchdog stop koha-242
# stop koha-242
2010-03-16T23:49:55 koha-242 stop
2010-03-16T23:49:55 koha-242 kill -SIGPWR 26086
2010-03-16T23:50:11 koha-242 stoped
In fact, you can use halt or reboot if you don't like stop and restart, just to keep one mapping less in your brain when working with it.

Log files are created for each container in /tmp/name.log. They include lxc-start output with boot messages and any output that started scripts might create which is useful for debugging container installations. Output from watchdog monitoring /var/run/utmp in container is also included, and it reports number of tasks (processes) in container, and here is example of stopping container:

root@prod:/srv# tail -5 /tmp/koha-242.log
2010-03-16T23:49:56 koha-242 66 tasks
2010-03-16T23:50:04 koha-242 22 tasks
2010-03-16T23:50:11 koha-242 runlevel 2 0
2010-03-16T23:50:11 koha-242 halt
2010-03-16T23:50:12 koha-242 watchdog exited
Hopefully this will make your switch to Linux Containers and recent kernels easier...

I know that title is mouthful. But, I occasionally use this blog as place to dump interesting configuration settings and it helps me remember configuration which helps me to remember it and might be useful to lone surfers who stumbles upon this page.

graph.png

This weekend our nice network admin upgraded VLAN setup to enables 1Gb/s network across whole private segment. That is clearly visible in green arrows on picture, especially if you compare it with last one. We still have a few slower links (100 Mb/s) which pass through NAT to Internet (red arrows), but we now have private segment on every server in library and system room in main building and each server has IP address in new 1 Gb/s segment (you can notice that by blue arrows which are loopback interface on same machine).

All is not well, however. I had to reconfigure my OpenVZ containers from point-to-point ip configuration using venet devices to ethernet bridge setup because multiple hops on OpenVZ machine produced havoc with connections from our private network to containers. It was very wired, I saw TCP retransmission requests, but first packet somehow managed to pass through. ICMP traffic worked (thanks to small packet sizes), but I can't honestly say why our new VLAN setup and/or OpenVZ had problem with it. Up to that point, I just had private IP addresses assigned to OpenVZ container using vzctl set --ipadd 10.60.0.12 and ping -R did show multiple public and private addresses, but it all somehow worked.

First, I had to make network bridge which will be new VLAN 60

root@koha-hw:~# cat /etc/network/interfaces

auto br60
iface br60 inet static
        bridge_ports eth1 veth212226
        bridge_fd 0
        address 10.60.0.10
        netmask 255.255.254.0
        gateway 10.60.0.1
Then, I removed old private IP addresses:
root@koha-hw:~# vzctl set 212226 --ipdel 10.60.0.12 --save
and add new veth device (my version of vzctl requires MAC addresses, so beware!):
root@koha-hw:~# vzctl set 212226 --netif_add veth1,00:12:34:56:78:9A,veth212226,00:12:34:56:78:9B,br60 --save
This create veth1 device inside container to which I can assign IP address:
koha:~# ifconfig veth1 10.60.0.12 netmask 255.255.254.0 up
I decided to put that in /etc/rc.local because /etc/network/interfaces is managed by OpenVZ.

Next, I needed to reconfigure my ssh VPN which was using point-to-point tunneling with tap into real ethernet tunnel:

root@brr:~# tail -10 /etc/network/interfaces 

# vpn lib -> home
auto tap0
iface tap0 inet static
        pre-up ssh -M -S /var/run/tap0 -v -f -i /root/.ssh/koha-hw-tun0 -w 0:0 -o Tunnel=ethernet -o ServerAliveInterval=5 -o ServerAliveCountMax=2 koha-hw.ffzg.hr true
        address 10.60.0.81
        netmask 255.255.0.0
        up iptables -t nat -A POSTROUTING -s 192.168.1.0/24 -o tap0 -j MASQUERADE
        post-down ssh -S /var/run/tap0 -O exit koha-hw.ffzg.hr
On remote side, force tunnel number and add new device to bridge:
root@koha-hw:~# head -1 /root/.ssh/authorized_keys 
tunnel="0",command="ifconfig tap0 up ; brctl addif br60 tap0" ssh-rsa AAAAB3Nza...

Finally, little cron job to start (and restart) VPN:

root@brr:~# cat /etc/cron.d/tap0 
SHELL=/bin/sh
PATH=/usr/local/sbin:/usr/local/bin:/sbin:/bin:/usr/sbin:/usr/bin
*/1     * * * * root    fping -q 10.60.0.10 || ( ifdown tap0 ; ifup tap0 )

Last few weeks I have been struggling with memory usage on one of machines which run several OpenVZ containers. It was eating whole memory in just few days:

koha-hw-memory-week.png

I was always fond of graphing system counters, and since reboots are never a good thing something had to be done. One of first things that jumps out is that weekends are quiet, and don't generate 1Gb of additional memory usage. So it had something to do with out workload when library was open. But, what?

Even, worse, it all started only two weeks ago!

koha-hw-memory-month.png

Occasional look at ps axvv wasn't really something which is useful in debugging this problem, and I needed more precise information. So, I opted for simplest possible solution: record memory usage using vzps from crontab with following shell script:

#!/bin/sh

cd /srv/ps-trend 
dir=`date +%Y-%m-%d`
test -d $dir || mkdir $dir
COLUMNS=256 vzps -eo veid,pid,ppid,ni,user,rss,sz,vsz,time,stat,f,command > $dir/`date +%H%M`

After collecting several hours of trace, I decided to group them by container, and by all processes which have more than 64Mb of memory usage. Sometimes, it's amazing how solution jumps out by itself if you describe your problem good enough to computer (and draw a graph :-)

ps-hourly.png

After I identified that two Apache instances where eating memory like crazy, I remembered one of fellow sysadmins who complained about threaded Apache installation where some Apache child processes would mysteriously take 256Mb of RAM memory each. Just some, not all. Of course, I had several of them.

My solution to problem was also simple:

# sudo apt-get install apache2-mpm-prefork

It seems that threaded model in current Apache 2 just isn't good for me. Which is strange because application is basically a bunch of CGI scripts.

Result is not bad: 1Gb of additional free memory (which will be used for file-system cache). Not leaking anymore will also save us from hitting swap which was so bad that first reboot was needed. If nothing else, remember that tracing system counters and graphing them is always good investment in time, because pictures can tell different story than raw data. Especially if you have a lot of raw data (20k per minute in this case)

It would be nice to turn this into full monitoring solution. I really like idea of minimal client deployment for monitoring, so something like ps and curl to push data directly to graphing server, and triggered from crontab (with possibility to parse e-mail and insert them for later recovery from network interruptions) might just be a solution which I would recommend. Remember, Linux is operating system. It can do a lot of thing by itself :-)

If you just want light-weight graphs for your machines RRD::Simple Monitoring server has light-weight perl client (single perl script which submits to CGI script on server) which is triggered from cron. This project was inspiration to give RRD::Simple a try.

It seems that I wasn't the first one to have idea of sharing MySQL installation between OpenVZ containers. However, simple hardlink didn't work for me:

root@koha-hw:~# ln /vz/root/212052/var/run/mysqld/mysqld.sock \
     /vz/root/212056/var/run/mysqld/
ln: creating hard link `/vz/root/212056/var/run/mysqld/mysqld.sock' to
    `/vz/root/212052/var/run/mysqld/mysqld.sock': Invalid cross-device link
So I tried something a little bit different:
root@koha-hw:~# mount --bind /vz/root/212052/var/run/mysqld/ \
     /vz/root/212056/var/run/mysqld/
Which worked for me on old etch Debian kernel:
root@koha-hw:~# uname -a
Linux koha-hw 2.6.18-openvz-18-53.5d1-amd64 #1 SMP Sat Mar 22 23:58:13 MSK 2008 x86_64 GNU/Linux
I have wrong permissions, but socket is world-writable anyway... There is also related bug for kernels 2.6.24 and 2.6.26.

I'm working on Linux version of Sun storage machines, using commodity hardware, OpenVZ and Fuse-ZFS. I'm do have working system in my Sysadmin Cookbook so I might as well write a little bit of documentation about it.

My basic requirements are:

This makes it self-running system which won't fall over itself, so let's see how does it look:

root@opl:~# zpool status
  pool: opl
 state: ONLINE
 scrub: resilver completed after 1h59m with 0 errors on Wed Jun  3 15:29:50 2009
config:

        NAME        STATE     READ WRITE CKSUM
        opl         ONLINE       0     0     0
          mirror    ONLINE       0     0     0
            sda2    ONLINE       0     0     0
            sdb2    ONLINE       0     0     0

errors: No known data errors
root@opl:~# zfs list
NAME                           USED  AVAIL  REFER  MOUNTPOINT
opl                            183G  35.7G    21K  /opl
opl/backup                     180G  35.7G    22K  /opl/backup
opl/backup/212052             76.1G  35.7G  8.12G  /opl/backup/212052
opl/backup/212052@2009-05-01  5.69G      -  7.50G  -
opl/backup/212052@2009-05-10  5.69G      -  7.67G  -
opl/backup/212052@2009-05-15  5.57G      -  7.49G  -
opl/backup/212052@2009-05-22  3.54G      -  7.74G  -
opl/backup/212052@2009-05-25  3.99G      -  8.38G  -
opl/backup/212052@2009-05-26  3.99G      -  8.38G  -
...
opl/backup/212052@2009-06-05  3.72G      -  8.09G  -
opl/backup/212052@2009-06-06      0      -  8.12G  -
opl/backup/212056             1.42G  35.7G   674M  /opl/backup/212056
opl/backup/212056@2009-05-30  37.1M      -   688M  -
opl/backup/212056@2009-05-31  47.3M      -   747M  -
opl/backup/212056@2009-06-01  40.9M      -   762M  -
opl/backup/212056@2009-06-02  62.4M      -   787M  -
...
opl/backup/212056@2009-06-05  12.1M      -  1.02G  -
opl/backup/212056@2009-06-06      0      -   674M  -
opl/backup/212226              103G  35.7G  26.8G  /opl/backup/212226
opl/backup/212226@2009-05-05  4.29G      -  26.7G  -
opl/backup/212226@2009-05-10  4.04G      -  26.6G  -
opl/backup/212226@2009-05-15  4.19G      -  26.6G  -
opl/backup/212226@2009-05-22  4.12G      -  26.7G  -
opl/backup/212226@2009-05-23  4.12G      -  26.7G  -
opl/backup/212226@2009-05-24  4.09G      -  26.6G  -
opl/backup/212226@2009-05-25  4.14G      -  26.7G  -
opl/backup/212226@2009-05-26  4.13G      -  26.7G  -
...
opl/backup/212226@2009-06-05  4.20G      -  26.8G  -
opl/backup/212226@2009-06-06      0      -  26.8G  -
opl/clone                      719M  35.7G    25K  /opl/clone
opl/clone/212056-60018         666M  35.7G  1.39G  /opl/clone/212056-60018
opl/clone/212226-60017        53.0M  35.7G  26.7G  /opl/clone/212226-60017
opl/vz                        1.59G  35.7G  43.5K  /opl/vz
opl/vz/private                1.59G  35.7G    22K  /opl/vz/private
opl/vz/private/60014           869M  35.7G   869M  /opl/vz/private/60014
opl/vz/private/60015           488M  35.7G   488M  /opl/vz/private/60015
opl/vz/private/60016           275M  35.7G   275M  /opl/vz/private/60016
There are several conventions here which are useful:
  • pool is named same as machine (borrowing from Debian way of naming LVM volume groups) which makes it easy to export/import pools on different machines (I did run it with mirror over nbd for a while)
  • snapshots names are dates of snapshot for easy overview
  • clones (writable snapshots) are named using combination of backup and new container ID

There are several things which I wouldn't be able to get without zfs:

  • clones can grows as much as they need
  • data is compressed, which increase disk IO as result
  • zfs and zpool commands are really nice and intuitive way to issue commands to filesystem
  • zpool history is great idea of writing all filesystem operations to internal log
  • ability to re-sliver (read/write all data on platters) together with checksums make it robust to disk errors

My point of view

First, let me explain my position. I was working for quite a few years in big corporation, and followed EMC storage systems (one from end of of last century and improvement that Clarion did on our production SAP deployment). I even visited EMC factory in Cork, Ireland, and it was very eye-opening experience. They claim that 95% of customers who visited factory did buy EMC storage, and I believe them (we did upgrade to Clarion btw).

In my Linux based deployments on HP, Compaq and IBM hardware I did various crazy RAID configurations (RAID5 across disks on controller and then stripe across other controller, for example). Those where the easy parts: you got RAID controller with DRAM cache (~256Mb) and some kind of battery backup which greatly improved write performance.

Later on in CARNet we had HP EVA storage which proved quite flaky. I heard from friend in one enterprise deployment that they use them only for testing. And you know, it's just shelf of disks with redundant controllers and fiber interface...

In the mean time, on Linux software RAID front, I used md implementation RAID1 and RAID5 back in the days when Linux distributions couldn't handle that.

Solid state drives

However, solid state drives changed a lot of that. I still haven't had pleasure to use Intel SSD which are supposed to be good, but USB sticks are also flash storage, but with quaky characteristics.

This particular one is ID 0951:1603 Kingston Technology Data Traveler 1GB/2GB Pen Drive as reported by Linux, but in fact 8Gb model which seem to have 128Mb of memory which is writable at about 6Mb/s and after that write speed drops to 45K/s.

On the other hand, there is ZFS on FUSE project which enables some really interesting applications of Sun's (and now Oracle) file-system. I do have to mention Sun at this point. Ever since I heard about Oracle's acquisition of Sun, I have wondered what will happen with ZFS. I might even suspect that ZFS is the main reason why Oracle bought Sun. Let me explain...

Sunshine Oracle

If you look at database market (where Oracle is), the only interesting thing to improve relational databases is to make them extremely fast. And that revolution is already here. Don MacAskill from SmugMug makes compelling case about performance of SSD storage. If you don't believe words, watch this video from 24:50 to see solutions to MySQL storage performance problem: hardware!. Sun's hardware. Do you think that Oracle didn't noticed that?

Enterprise storage cheaply

Did you watched the video? I really don't agree that it's hardware. Common! It's Opteron boxes with custom built SSD disks optimized for write speed. SSD with super-capacitors instead of batteries in old RAID controller.

But, to make it really fun, I will try to re-create at least some of those abilities using commodity hardware in my university environment. I have Dell's OptiPlex boxes which come loaded with a lot of goodies to put together a commodity storage cluster:

  • Intel
  • Intel(R) Core(TM)2 Duo CPU E6550 @ 2.33GHz
  • 3Gb RAM
  • 2 SATA disks with ~80Mb/s of read/write performance
  • multi-card reader and 8 USB slots
  • fake software RAID on Intel chipset (supported by dmraid but even it's documentation suggests not to use it)

ZFS

Why ZFS? Isn't btrfs way to go? For this particular application, I don't think so. Let me list features of ZFS which excite me:

  • ability to store log to separate (mirror) device (SSD, USB sticks if that helps)
  • scrub: read all bytes on disk and rewrite it (beats smartctl -t long because it also re-allocates bad blocks, I've seen 80Mb/s scrub)
  • balancing of IO over devices (I will use this over nbd to split mirror between machines for fail-over)
  • arbitrary number of copies (nice for bigger clusters of storage machines)
  • nice snapshots which display it's size and can be cloned to writable ones
  • snapshot send/receive to make off-site backup copies
  • L2ARC - balance read and write cache over SSD devices with different characteristics (USB sticks have fast read and slow write, so they might be good fit)

You might think of it as git with POSIX file-system semantics.

But, it's in user space, you say, it must be slow! It isn't. Really. Linux user-space is much faster than disk speed and having separate process is nice for monitoring purposes. File-system overhead gets counted into user time, not system, so system time is clear indicator of driver (hardware) activity and not file-system overhead.

I have most parts of this setup ready, and I'm using it to backup OpenVZ containers. So, I'm running OpenVZ kernel and I can even make virtual machines from backup snapshots to recover into some point in time. After I finish this setup, expect a detailed guide (it will probably be part of my upcoming virtualization workshop as alternative to LVM).

I'm preparing walk-through screencasts for workshop about virtualization so I needed easy way to produce console screencasts.

First, I found TTYShare which displays ttyrec files using flash, but I really wanted to copy/paste parts of commands and disliked flash plugin requirement.

It seems that I wasn't only one who wanted JavaScript client for ttyrec. jsttplay can produce screencasts like this one about OpenVZ using plain copy/paste friendly JavaScript within browser.

But, for some parts (like Debian installation under VirtualBox) I really needed movie capture. x11grab option from ffmpeg seemed easy enough to use:

ffmpeg -f x11grab -s 640x480 -r 10 -i :0.0 /tmp/screencast.avi
but getting right window size isn't something I want to do by hand. So, I wrote small perl script record-screencast.pl which extract window position and size using xwininfo and pass it to ffmpeg so I don't have to.

I have written about data migration from disk to disk before, but moving data off the laptop is really painful (at least for me). This time, I didn't have enough time to move files with filesystem copy since it was painfully slow and transferred only 20Gb from 80Gb of data in two hours. I seen 3M/s transfers because of seeking in filesystem, so something had to be done!

So, let's move filesystem images. Limiting factor should be speed of disk read. Have in mind that 100Mb/s full-duplex network (over direct cable) will bring you just 12Mb/s which is much less than normal laptop 5400 rpm disk can deliver (around 30Mb/s of sequential read -- you can check that with hdparm -t).

Since I'm coping data to RAID5 array, I can assume that any operation on images will be much quicker than seek times on 5400 rps disk which is in laptop.
Let's see which partition we have on laptop:

llin:~# mount -t ext3,reiserfs
/dev/mapper/vg-root on / type ext3 (rw,noatime,errors=remount-ro)
/dev/sda1 on /boot type ext3 (rw)
/dev/mapper/vg-rest on /rest type reiserfs (rw,noatime,user_xattr)

First start netcat (on machine with RAID array) which will receive image. I'm using dd_rescue to display useful info while transfering data... If you don't have it, just remove it from pipe.

root@brr:/backup/llin-2008-01-12# nc -l -p 8888 | dd_rescue - - -y 0 > boot.img

Then start transfer on laptop:

llin:~# nc 192.168.2.20 8888 < /dev/sda1

Repeat that for all filesystems like this:

root@brr:/backup/llin-2008-01-12# nc -l -p 8888 | dd_rescue - - -y 0 > root.img
llin:~# nc -w 1 192.168.2.20 8888 < /dev/vg/root

root@brr:/backup/llin-2008-01-12# nc -l -p 8888 | dd_rescue - - -y 0 > rest.img
llin:~# nc -w 1 192.168.2.20 8888 < /dev/vg/rest

While you are waiting for copy to finish, you can use dstat, atop, vmstat or any similar command to monitor progress, but I came with this snippet:

root@brr:~# watch "df | egrep ' (/backup|/mnt/llin)' ; echo ; ls -al /backup/llin*/*.img"

which produce something like this:

Every 2.0s: df | egrep ' (/backup|/mnt/llin)' ; echo ; ls -al /bac...  Mon Jan 12 23:30:21 2009

125825276 112508688 13316588 90% /backup
82569904 22477768 60092136 28% /mnt/llin
25803068 24800808 740116 98% /mnt/llin.img/root

-rw-r--r-- 1 root root 45843283968 2009-01-12 23:30 /backup/llin-2008-01-12/rest.img
-rw-r--r-- 1 root root 26843545600 2009-01-12 23:07 /backup/llin-2008-01-12/root.img

I decided to rsync files, since I already had 20Gb of them in file system. First you have to recover journal (since we where coping live devices, journal isn't finished and loopback device won't allow us to mount filesystem):

root@brr:/backup# e2fsck llin-2008-01-12/root.img 
e2fsck 1.41.3 (12-Oct-2008)
llin-2008-01-12/root.img: recovering journal
llin-2008-01-12/root.img: clean, 689967/3276800 files, 6303035/6553600 blocks (check in 4 mounts)

root@brr:~# e2fsck /backup/llin-2008-01-12/rest.img

root@brr:~# reiserfsck /backup/llin-2008-01-12/rest.img

If you don't want to wait for reiserfs to finish check, you can abort it when it starts checking of filesystem because we only care about first step which will recover journal.
Next, we will mount images (read-only) using loopback:

root@brr:~# mkdir /mnt/llin.img
root@brr:~# mount /backup/llin-2008-01-12/root.img /mnt/llin.img/ -o ro,loop
root@brr:~# mount /backup/llin-2008-01-12/boot.img /mnt/llin.img/boot/ -o ro,loop
root@brr:~# mount /backup/llin-2008-01-12/rest.img /mnt/llin.img/rest/ -o ro,loop

And finally rsync rest of changes to directory

root@brr:~# rsync -ravHS /mnt/llin.img/ /mnt/llin

After that, I used files to start OpenVZ virtual machine which will replace my laptop for some time (if you know good second-hand laptop for sale, drop me an e-mail).

My mind is just too accustomed to RDBMS engines to accept that I can't have GROUP BY in my shell pipes. So I wrote one groupby.pl.


Aside from fact that it somewhat looks like perl golfing (which I'm somewhat proud of), let's see how does it look:


dpavlin@llin:~/private/perl$ ps axv | ./groupby.pl 'sum:($6+$7+$8),10,count:10,min:($6+$7+$8),max:($6+$7+$8)' | sort -k1 -nr | head -10 | align
440947 /usr/lib/iceweasel/firefox-bin 1 440947 440947
390913 /usr/sbin/apache2 11 22207 39875
180943 /usr/bin/X 1 180943 180943
135279 /usr/bin/pinot-dbus-daemon 1 135279 135279
122254 mocp 2 25131 97123
84887 pinot 1 84887 84887
78279 postgres: 5 10723 21971
70030 /usr/bin/perl 6 6959 15615
50213 /bin/bash 7 6351 7343
49266 /usr/lib/postgresql/8.2/bin/postgres 2 24631 24635

This will display total usage for process, it's name, number of such processes and range of memory usage. We can then use old friend sum.pl to produce console graph, but I already wrote about it.


So, let's move to another example, this time for OpenVZ. Let's see how much memory is each virtual machine using (and get number of processes for free):


$ vzps -E axv --no-headers | ./groupby.pl 'sum:($7+$8+$9*1024),1,count:1'
2209504127 0 265
611768242 212024 38
162484775 212037 19
170797534 212052 38
104853258 212226 26
712007227 212253 21

But wouldn't it be nice to display hostnames instead of VEID numbers? We can, using --join and --on options (which are really backticks on steroids):

$ vzps -E axv --no-headers | ./groupby.pl 'sum:($7+$8+$9*1024),1,count:1' --join 'sudo vzlist -H -o veid,hostname' --on 2
2146263206 0 259
675835528 saturn.ffzg.hr 40
162484775 arh.rot13.org 19
170797534 koha-dev.rot13.org 38
104853258 koha.ffzg.hr 26
712011323 zemlja.ffzg.hr 21

Which brings us to final result:

$ vzps -E axv --no-headers | ./groupby.pl 'sum:($7+$8+$9*1024),1,count:1' --join 'sudo vzlist -H -o veid,hostname' --on 2 | sort -rn | align | ./sum.pl -h
0 260 2105M OOOOOOOOOOOOOOOOOOO 2105M
zemlja.ffzg.hr 21 679M OOOOOO------------------- 2784M
saturn.ffzg.hr 35 512M OOOO-------------------------- 3296M
koha-dev.rot13.org 38 162M O------------------------------ 3459M
arh.rot13.org 19 154M O-------------------------------- 3614M
koha.ffzg.hr 26 99M ---------------------------------- 3714M

So, here you have it: SQL like query language for your shell pipes.