 Several months ago, I got
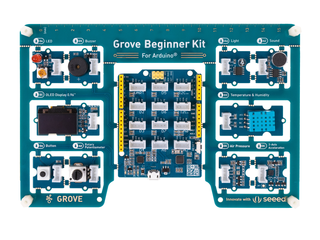
Grove Beginner Kit For Arduino for review. I wanted to see if this board would
be good fit for my friends which aren't into electronics to get them started with it.
Several months ago, I got
Grove Beginner Kit For Arduino for review. I wanted to see if this board would
be good fit for my friends which aren't into electronics to get them started with it.
So, I started with general idea: collect values from sensors, send them to InfluxDB and create graphs using Grafana. In my opinion, showing graphs of values from real world is good way to get started with something which is not possible without little bit of additional hardware, and might be good first project for people who didn't get to try Arduino platform until now.
Kit is somewhat special: out of the box, it comes as single board with all sensors already attached, so to start using it, you just need to connect it to any usb port (it even comes with usb cable for that purpose). It also has plastic stand-offs which will provide isolation of bottom side from surface on which it's placed.
It provides following sensors on board:
| Modules | Interface | Pins/Address |
| LED | Digital | D4 |
| Buzzer | Digital | D5 |
| OLEDDisplay 0.96" | I2C | I2C, 0x78(default) |
| Button | Digital | D6 |
| Rotary Potentiometer | Analog | A0 |
| Light | Analog | A6 |
| Sound | Analog | A2 |
| Temperature & Humidity Sensor | Digital | D3 |
| Air Pressure Sensor | I2C | I2C, 0x77(default) / 0x76(optional) |
| 3-Axis Accelerator | I2C | I2C, 0x19(default) |
So I decided to show temperature, humidity, pressure, light and sound. I also added ability to show measurements on built-in oled display if you press button. Why the button press? In my experience, oled displays are prone to burn-in, and since main usage of this sensor board will be sending data to the cloud, it would be wasteful to destroy oled display which won't be used most of the time.
Programming Arduino sketch was easy using Groove Kit wiki pages which nicely document everything you will need to get you started. However, I noticed that wiki suggest to use Arduino libraries which have Grove in it's name, so I was wondering why is that so. Turns out that DHT11 temperature and humidity sensor and BMP280 temperature and pressure sensor use older version of Adafruit libraries which aren't compatible with latest versions on github. So, I tested latest versions from Adafruit and they work without any problems, just like Grove version. If you are already have them installed, there is no need to install additional Grove versions.
If you deploy sensor like this (probably connected to small Linux single board computer) it would be useful if it would be possible to update software on it witout need to run full Arduino IDE (and keyboard and mouse), so I decided to write a Makefile which uses and installs arduino-cli which is go re-implementation of support which is available in Arduino IDE, but written in go that enables usage from command-line (over ssh for example).
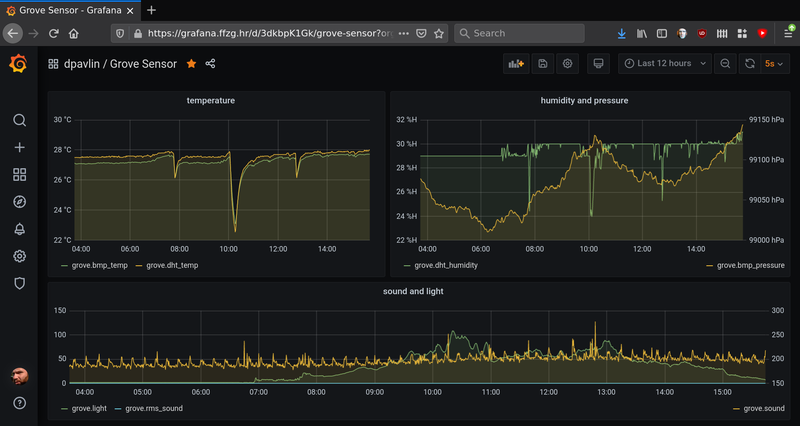
So if you are interested in trying this out, and want to get graphs similar to one above, go to GroveSensor github repository clone it to your Raspberry Pi, issue make to build it and make upload to send it to your board. You will also need to edit influx.sh to point it to your InfluxDB instance, and you can start creating graphs in Grafana. All this will also work on other platforms (like x86, amd64 or aarm64) thanks to arduino-cli install script.